- Главная
- Авиация и космонавтика
- Административное право
- Акционерное право
- Английский
- Антикризисный менеджмент
- Биографии
- Автомобильное хозяйство
- Автотранспорт
- Культура и искусство
- Маркетинг
- Международное публичное право
- Международное частное право
- Международные отношения
- Менеджмент
- Металлургия
- Муниципальное право
- Налогообложение
- Оккультизм и уфология
- Педагогика
- Политология
- Право
- Предпринимательство
- Психология
- Радиоэлектроника
- Риторика
- Социология
- Статистика
- Страхование
- Строительство
- Схемотехника
- Таможенная система
- Теория государства и права
- Теория организации
- Теплотехника
- Технологии
- Товароведение
- Транспорт
- Трудовое право
- Туризм
- Уголовное право и процесс
- Управление
- Сочинения по литературе и русскому языку
- Другое
Курсовая работа: Working out of the search algorithm of failures of Air Conditioning System of TU-154Курсовая работа: Working out of the search algorithm of failures of Air Conditioning System of TU-154Ministry of education and science of Ukraine National Aviation University Course work on the discipline Diagnostics of aircraft state ‘Working out of the search algorithm of failures of Air Conditioning System of TU-154’ the work is performed by the student of 505 FLA D. Zhuravel the work is checked by: Y. A. Sapeljuk Kyiv 2009 Content1. Work’s goal 2. Description of ACS of Tu-154 3. Principal scheme of ACS of Tu-154 4. Theoretical base of algorithm developing process 5. Description of obtained algorithm Description and operating principles of Air-Conditioning System of Tu-154The air conditioning system (ACS) provides pressurization, ventilation, heating of the pressure cabin. Air is taken from the 9th compressor stage of three engines in amount of 5000-5500 kg/h, temperature is between 240 - 350 °C and differential pressure is 7,5 - 9kg/sm2. The ACS supply conditioned air to the control cabin, passenger cabin, electronic equipment compartment, forward cargo compartment, air conditioning distribution bay and aft cargo compartment, and provides constant pressure and temperature in pressure cabin. It is maintained by air flow regulation. Air supply to the air conditioning system is furnished by the pneumatic system from either engine bleed air or the auxiliary power unit (APU) in flight; from engine bleed air, APU bleed air, ground pneumatic supply cart, or from a ground conditioned air supply cart during ground operation. All cold air required for air conditioning is provided by air conditioning packs. Passing bleed air through a primary heat exchanger, an air cycle machine, and a secondary heat exchanger cools the air sufficiently to handle any cooling situation required. A ram air system provides coolant air for the heat exchangers. In each of three pipelines there is regulated check valve to prevent air masses flow in returned direction. Pipelines attachment is realized with the help of compensators. Further three pipelines are connected into single one mainline, which leads to the first cooling stage - preliminary air-to-air heat exchanger. Temperature of hot air after AAHE is ranged between 100 - 200°C. AAHE is the first stage of cabin air cooling maintained by atmosphere ram-air flow. AAHE is one-flow. In case of overcooling there is by-pass line to bleed off air besides AAHE. Before air enters pressure cabin the main line is divided on two parallel pipelines: right and left. They lead to two main cooling stages, where AAHEs and air cycle machines installed. Here, after AAHE air temperature should be not more than 60°C, behind ACM - 10 - 20°C. In case of overcooling there are two by-pass lines besides AAHE and ACM. By-pass of air is carried by air distributers mounted on AAHE. Regulation of distributers is automatic or manual. ACM has two functions: to cool air flowing from AAHE being secondary stage of air cooling; to suck scavenged air through AAHE during ACS operation being on the ground. There is also oil system of ACM. It`s function is to lubricate ACM bearings. Then air comes to distributive main line where air mixtures and air distributers are located. Air mixture is used to mix cold and hot air. Air distributors of hot and cold air are used to regulate definite temperature of air in pressure cabin. Noise suppression device. Theoretical basis of working out of algorithmFor algorithm working out let’s use the method that is based on the theory of information. In it the leading function is information quantity, which can be got during control of diagnostic parameter or making another check. By the results of the check we define diagnose of the system. Practically, the process of the algorithm working out begins from the construction of the table of functional failures and calculation of information quantity, got during every check, and then the algorithm of failures searching is formed. During this there are considered certain functional system of the aircraft, structure of its aggregates and principle of their work, and also parameters, which characterize system workability and signs of failures and defects appearance. Aggregates, which are included to the system, in the process of operation fail. Failures happen for different reasons, among which the most wide-spread are wear and failure of the aggregate’s elements, shrink of the springs, loose of pressurization, jamming of slide valves, filter clogging etc. Certain type of the aggregate failure is considered as its diagnose Di, which is followed by certain signs (parameters) Xi, which become evident in operation and are fixed during use of the system by the assignment or during making of maintenance. Functions of the failures are made for hydraulic system of retraction-extension of landing gear of the aircraft, table 1. Functions of the system failures. Table 1
Abbreviations and reference designation: Diagnoses: D1 - incorrect tubes` installation D2 - non-pressurized internal cavity D3 - weakened fitting D4 - damage of a housing D5 - non-pressurized part of line D6 - wrong installation * - number of diagnoses that are controlled by this sign ** - diagnoses, which are controlled Signs of failures: X1 - raised temperature in pipeline X2 - unsatisfactory pressurization of right mainline X3 - unusual noise in the cabin X4 - no air supply to ACS X5 - fumes in passenger cabin Evaluation of probability of diagnoses appearance is calculated by the formula:
where ni - number of cases of appearance of і diagnose; N - number of all diagnoses of system aggregates. In the table 1 there are written aggregates’ names, their possible diagnoses, and their signs. If some sign from the totality Xj corresponds to diagnose Di on the crossing of their columns we put the sign (+), that shows stochastic relation between them. Presence of relations between diagnoses and signs is defined by the making of engineering analysis of work of the system and its aggregates with taking into account possibilities of system control, which is used on the given type of aircraft. Diagnoses are chosen by statistic data that are collected on operational enterprises in the process of operation of aviation technique. For functional systems of the aircraft it is typical the appearance simultaneously several signs during failures appearance, that is underlined presence of several signs (+) in the columns of the table 1. Data analysis attests that some signs may be shown in appearance of different failures and defects of aggregates, that’s why in penultimate line there are written number of diagnoses, which are controlled by each sign. If some sign is shown in appearance of several diagnoses, then its appearance may be caused by appearance of either one diagnose or another one, and also when diagnoses appear together. That’s why in the last line of the table there are written possible combinations of the diagnoses. In spite of that during analysis of functional systems of the aircraft it is considered that simultaneous appearance of several types of the failures of aggregates, but from theoretical point of view accounting uncertainty of information about the state of aggregates, in the case of appearance of such situation it is necessary to take into account this possibility. For usage of mathematical apparatus of theory of information it is necessary to define values of probabilities qi of appearance of this or that diagnose. For their calculation in penultimate column of the table there are written number of cases of appearance of each diagnose by statistical data, which are collected for some period of AT operation. It is evident that it is not possible to calculate probability of diagnose appearance, but it is possible to get their evaluation. Control of one or several parameters (signs) of the system, which is called check, gives information j about presence of aggregate diagnose. Quantity of information, accounting that we consider dichotomy, is evaluated as difference between level of system state uncertainty before H (S) and after check H (S/nj): J= H (S) - H (S/nj). (2) Level of uncertainty of system states before the check in condition that system can be unworkable as a result of appearance of only one any diagnose from their general quantity with probability qk is calculated by the formula:
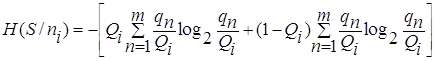
Level of uncertainty of system states after the check:
Where Then Setting of the diagnose in the system should be begun from the check ni, which carries the greatest quantity of information. As a result of making of the check table 1 is transformed. We will two tables as a result of this. If in the first check it is fixed that sign was confirmed (such situation is signed as R = 1), diagnoses should be looking for in that totality, with which this sign has stochastic relation. Second step for refinement of diagnose is made with the help of transformed table, which includes m diagnoses. As in the previous case setting of diagnose will be made with taking into account quantity of information, got during second check. Quantity of information in this case is calculated by the formula:
If R = 0, that means sign is not confirmed, then search of diagnose is made by another transformed table, which includes diagnoses from the number m+1…N. in such case quantity of information is calculated by formula:
For usage of expressions (1) - (7) it is made table of calculated-informational data (table 2). Table of calculated-informational data. Table 2
Algorithm for checking of aggregate state. Table 3
Description of obtained algorithmSo, using this algorithm of malfunctions discovering we can compose an order of system checking, namely, steps of inspection (diagnostics). These steps are: 1. Check internal cavity of air-to-air heat exchanger 2. Check correctness of tubes installation 3. Check fittings of air-cycle machine 4. Inspect noise suppression device housing for cracks 5. Inspect places of pipeline and other aggregates mounting 6. Check correctness of installation List of abbreviations: 1. ACS - air conditioning system 2. AAHE - air-to-air heat exchanger 3. ACM - air-cycle machine 4. NSD - noise suppression device. |
||||||||||||||||||||||||||||||||||||||||||||||||||||||||||||||||||||||||||||||||||||||||||||||||||||||||||||||||||||||||||||||||||||||||||||||||||||||||||||||||||||||||||||||||||||||||||||||||||||||||||||||||||||||||||||||||||||||||||||||||||||||||||||||||||||||||||||||||||||||||||||||||||||||||||||||||||||||||||||||||||||||||||||||||||||||||||||||||||||||||||||||||||||||||||||||||||||||||||||||||||||||||||||||||||||||||||||||||||||||||||||||||||||||||||||||||||||||||||||||||||||||||||||||||||||||||||||||||||||||||||||||||||||||||||||||||||||||||||||


 ,
,
 , (1)
, (1)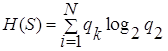 (3)
(3)
 (4)
(4)