- Главная
- Авиация и космонавтика
- Административное право
- Акционерное право
- Английский
- Антикризисный менеджмент
- Биографии
- Автомобильное хозяйство
- Автотранспорт
- Культура и искусство
- Маркетинг
- Международное публичное право
- Международное частное право
- Международные отношения
- Менеджмент
- Металлургия
- Муниципальное право
- Налогообложение
- Оккультизм и уфология
- Педагогика
- Политология
- Право
- Предпринимательство
- Психология
- Радиоэлектроника
- Риторика
- Социология
- Статистика
- Страхование
- Строительство
- Схемотехника
- Таможенная система
- Теория государства и права
- Теория организации
- Теплотехника
- Технологии
- Товароведение
- Транспорт
- Трудовое право
- Туризм
- Уголовное право и процесс
- Управление
- Сочинения по литературе и русскому языку
- Другое
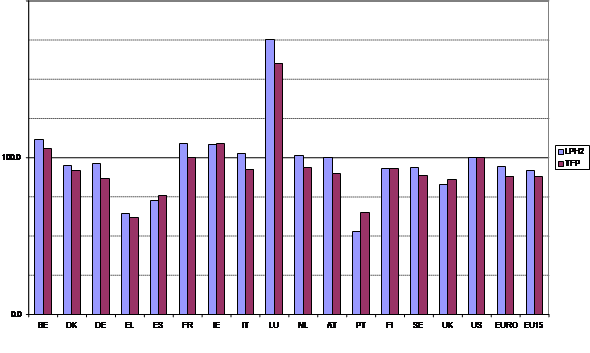
Реферат: Labour productivityРеферат: Labour productivityLabour productivity (essay) Abstract The analysis in this paper dismisses the notion of a genuine trade-off between employment and productivity growth. Obviously, misguided policies to exploit such a trade-off have to be avoided. However, there are no reasons to think that structural labour market reforms boosting employment will typically entail negative implications for longer-term productivity growth. The dynamic response of productivity to positive labour supply and wage shocks may entail a temporary reduction in productivity growth rates, which, in principle could be considered as benign; anyway, the size of a negative effect of this type is estimated to be fairly small. In particular, this paper reaches the following conclusions: (i) The increase in employment since the mid 90s has indeed been to a significant extent the result of such positive labour market shocks, with about one half of the additional jobs attributed to structural improvements; (ii) Positive employment shocks can only account for a very small fraction of the observed productivity slowdown; consequently, the decline of labour productivity growth must be considered as predominantly caused by other factors and probably not just a temporary phenomenon. 1. Introduction The so-called Lisbon strategy involves efforts on several fronts both to improve labour market performance and to raise productivity growth in the EU. This twin aspiration is neatly summed up in the phrase ‘more and better jobs’, which implies higher employment rates but also more productive, higher-quality employment. The strategy sets explicit targets for ‘more jobs’: an employment rate of as close as possible to 70% and a female employment rate of over 60% by 2010. The Stockholm summit a year later added a further target of an employment rate of 50% for older working-age people. Given the rate of employment growth required to meet these targets, the Lisbon conclusions also established an implicit target for productivity growth with the statement that – if the recommended measures were implemented against a sound macroeconomic background – it should be possible to achieve 3% GDP growth. These targets have met with criticism in some quarters on several counts. Some regarded them as over-ambitious, particularly since the European Council (as opposed to individual Member States) lacks full control of the necessary instruments to meet its objectives. There were doubts about whether a credible strategy had been set out, or even whether EU leaders realised the extent of the reforms that would be required. Others pointed to the risk of policy distortions – there are many ways to raise employment rates, for example, but not all of them are fully consistent with raising economic welfare. On the other hand, the Lisbon targets appeared to score an initial public relations success, being widely interpreted as a signal that the EU was taking economic reform seriously. (Even then, however, it was noted that this might damage the credibility of similar exercises were the targets to be missed by a wide margin.) Two clear advantages of the Lisbon strategy, and especially the employment rate targets, are often overlooked in these discussions. First, the commitment to raising employment rates (i.e. raising labour force participation as well as reducing unemployment) represents a clear rejection of an idea that has been one of the great weaknesses of European employment policy in recent decades, namely that high unemployment can be cured by discouraging labour supply. If this seems obvious today, it is not so long ago in some countries that married women were discouraged from working, while older workers were actively encouraged to quit the labour market through early retirement schemes, partly in response to high unemployment. Even more recently, governments in some EU Member States were entertaining a similar notion – that employment in persons might be boosted by means of regulatory restrictions on hours worked. Secondly, the Lisbon strategy embodies the idea that structural improvements in the functioning of markets are required for a sustained increase in employment rates and higher productivity growth. Clearly, at any given moment, output and (un-)employment are determined by real demand in the economy. However, over the longer term, real demand will generally tend towards a level consistent with stable inflation, this level being determined by overall supply conditions in the economy. By focusing on the functioning of labour, product and capital markets, as well as investments in R&D and human capital, the Lisbon strategy seeks to raise employment and growth potential in a sustainable manner. In addition, while one may ask whether the employment rate is the ideal variable to target, there is no doubt that low employment rates in several EU Member States are a symptom of poor labour market performance, and that improving labour market performance would lead both to higher employment rates and to greater economic welfare. The benefits of higher employment rates for the sustainability of the public finances (at least in the short-to-medium term) were also noted. Against this background, this paper focuses on a crucial question for the strategy of ‘more and better jobs’: whether and in what sense there are trade-offs between employment growth and productivity growth. Concern has been raised in some quarters that raising the employment rate in the EU will result in lower productivity growth. Indeed, there is a grain of truth in this: a rising employment rate implies that productivity growth will be temporarily below full potential, simply because the number of workers per unit of capital is increasing. In addition, those who move from unemployment or inactivity into employment are likely, on average, to have a relatively low level of productivity, at least at first. However, there are three reasons why this is not a cause for concern. First, the temporary negative effect on productivity growth is estimated to be rather small. Secondly, even if growth in productivity – GDP per employed person – is negatively affected, a higher employment rate unambiguously raises growth in GDP per capita in the short term. Newly employed people clearly contribute more to GDP than they used to, even if their productivity is below average. Thirdly, there are few reasons to think that a higher employment rate has any negative implications for longer-term productivity growth, which is what really matters for the competitiveness and dynamism of the EU economy. These points –important ones for the Lisbon strategy – are supported by two separate pieces of analysis: an econometric analysis of the dynamic response of productivity to structural employment shocks, and a simulation based on the Commission’s macroeconomic model. Thus, there is no genuine trade-off – in the sense of prioritising one of the two – between policies to raise the employment rate and policies to foster productivity growth. 2. More and better jobs – an example of goal inconsistency? 2.1 Background considerations At the moment, EU GDP per capita in purchasing power parities is around 70% of the US level, with 1/3 of the gap due to productivity differentials and 2/3 due to a lower labour input (i.e. a lower employment rate and hours worked compared with the US). Consequently, improving the EU’s productivity performance and raising employment is fundamental to increasing the long-term growth potential of the EU economy[1]. However, several observers have argued that the twin goals of raising both employment rates and productivity growth may be difficult, or even impossible to pursue simultaneously, given a perceived negative trade-off between employment and productivity. The basic argument for the existence of a negative relationship between employment and productivity is derived from straightforward comparative-static reasoning. For any standard production function, average factor productivity will decrease with rising output as the expansion of production will require the bringing in of less and less productive factors into operation – less fertile soil, older and less efficient equipment and machinery, workers with lower abilities and skills, etc. Then, obviously, higher employment will inevitably be associated with lower output per worker and vice versa. Thus, in such a comparative-static setting it is easy to construe a situation where, for example, regulations and restrictions excluding low productivity workers from employment result in a higher level of actual labour productivity, but it will come at the price of lower employment; similarly, reform efforts to price back low productivity workers into employment will mean more jobs, but this will be associated with lower overall productivity. In comparing labour productivity levels across countries, such considerations of a comparative-static nature can be useful. There appears to be widespread agreement that measured labour productivity in Europe relative to the US may be upwardly biased as a result of the exclusion of more low productivity workers. Indeed, the EU employment rate falls short of the US level by some 10 percentage points, with lower participation rates and higher unemployment rates disproportionately affecting low skill workers. In a similar vein, the capital-labour ratio appears to be typically higher in the EU than in the US, driving up measured labour productivity in Europe. Thus, both economic theory and a quick inspection of a few aggregate figures suggest that one should control for these effects in productivity comparisons. Obviously, in consequence, a Europe at full employment may well see a significantly larger labour productivity gap vis-à-vis the US than the current actual figures suggest. By how much could the productivity gap rise? A simple calculation could be performed focussing on comparisons of total factor productivity levels, using the following relationship: (1)Y/L = (K/L)1-α . TFP where Y/L denotes measured labour productivity, TFP is total factor productivity, K/L is the capital intensity of production and 1-α is the capital-elasticity of output in the constant-returns Cobb-Douglas case. For the calculation, GDP and the capital stock in PPP are taken from AMECO. Employment is civilian employment (LFS). Hours worked come from the GGDC (Groningen Growth and Development Centre). The results of this simple exercise suggest that the productivity gap between the euro area and the US, shown in the graph below, may be some 6 percentage points wider than the actual figures indicate. Graph 1: TFP and labour productivity gap
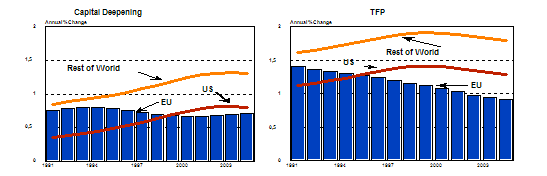
Source: Commission services However, the notion of a negative relationship between employment and productivity levels emerging in comparative-static considerations should not be confused with a genuine trade-off between employment and productivity in a long-run dynamic sense. One of the “big” stylised facts in economics is that in the long run technical progress is neutral with respect to employment. History has told us that the process of capital accumulation and technological innovation has not meant the “end of work” and despite notions of “factories without workers”, it is clear that from an overall perspective workers have not been replaced by machines. In standard economic growth theory this long-run neutrality proposition has been captured by the concept of labour-augmenting technical progress[2]. Along this balanced growth path, labour productivity, real wages and the capital intensity of production grow at the same rate, driven by (exogenous) technical progress. Technical progress is called total factor productivity growth, indicating that this concept should not be seen in a narrow “engineering” sense. Given that TFP determines our standards of living in the long run, clearly policy makers want it to grow faster than in recent years. Actual labour productivity growth can of course deviate from the balanced labour productivity growth rate over the short-to-medium term due to capital-labour substitution; faster than “balanced” productivity growth indicates labour shedding, and a shortfall of actual relative to “balanced” productivity growth is a characteristic of what is loosely called labour-intensive growth. Obviously, then, the employment neutrality hypothesis will not hold over the short-to medium term[3]. In consequence, pressing ahead with labour market reforms may entail a temporary reduction in measured productivity growth below full potential, but this should not be regarded as a trade-off in any sense. A higher employment rate implies an unambiguous increase in GDP per capita with no negative implications for the long-run productivity growth of the existing workforce. Thus, there is no inherent problem to act on both fronts simultaneously, raising the “balanced” rate of productivity growth using all the available instruments to stimulate TFP growth, whilst at the same time encouraging the labour-intensive growth in the medium term that is needed to move towards full employment[4]. 2.2 The dynamic employment-productivity relationship in recent years EU employment and productivity growth patterns have diverged sharply over recent years. Compared with the first half of the 1990’s, the period since then has witnessed a significant increase in the contribution of labour to EU GDP growth but unfortunately this has been accompanied by a reduction in the contribution from labour productivity, with labour productivity growth having come down by about one percentage point. From a purely growth accounting perspective, the 1 percentage point decline in EU labour productivity emanates from 2 sources. Firstly, 50% can be attributed to a reduction in the contribution from capital deepening i.e. lower investment. Secondly, the remaining 50% appears to emanate from a deterioration in total factor productivity i.e. a decline in the overall efficiency of the production process. On top of this, cyclical conditions are estimated to have depressed annual labour productivity growth by around 0.5 percentage points in recent years. By comparison, over the same timeframe, the US has been able to combine a strong employment performance with acceleration in labour productivity growth. Against this background, this section investigates to what extent the recent slowdown in labour productivity growth may merely reflect a response to a series of positive shocks to labour supply and jobs emanating from structural reforms and employment-friendly wage developments. Graph 2, as a starting point for the analysis, decomposes labour productivity growth into its two components, with the US and the Rest of World included for comparison purposes. The productivity growth slowdown is evident, with the EU’s long established superiority in terms of labour productivity growth having disappeared over recent years. Graph 2: Decomposition of Labour Productivity Trends
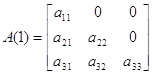
The benign interpretation of the observed productivity growth trends sees the recent deterioration in performance mainly as the mirror image of structural labour market improvements. Under this view the EU may now simply be in a transition phase whereby wage moderation and positive labour supply shocks may have initially created a negative trade-off between employment and productivity growth, basically via a temporary decline in capital-labour substitution. However, the dynamic adjustment path towards a new equilibrium with higher employment and lower structural unemployment will also involve capital accumulation that should eliminate the trade-off over the medium-term. The more pessimistic view, on the other hand, is that the labour productivity growth slowdown reflects a genuine negative shock, either in the form of a decline in total factor productivity growth or additional pressures on capital productivity; clearly, in such a scenario, prospects for a recovery of labour productivity growth are much bleaker. Obviously, both interpretations are likely to contain an element of truth, posing the analytical challenge to derive inference on the relative magnitude of the employment and productivity shocks and their respective consequences for overall productivity and employment developments. The picture is complicated by a third possible factor, namely aggregate demand. Both fiscal consolidation and precautionary household savings could have contributed to a decline in growth and, in particular, of productivity growth. We have employed both a structural VAR analysis and a simulation using the Commission’s QUEST model to study these three shocks, shocks to employment, shocks to productivity and shocks to aggregate demand and to measure their relative importance for productivity and employment. What is of specific interest in the context of this paper is the dynamic response of productivity to structural employment shocks. In technical terms, we use a structural VAR (SVAR) methodology, based on Stock and Watson (1988) and Blanchard and Quah (1990), for the identification of structural shocks. The intuition for shock identification in Blanchard and Quah is based on the idea that demand shocks only have temporary effects while supply shocks have permanent effects. Stock and Watson extend this approach and allow for separate supply contributions from labour and productivity (TFP). In order to identify different supply contributions, namely those coming from employment and those coming from productivity, additional identification criteria must be introduced. Stock and Watson use long run restrictions implied by the neoclassical growth model for that task. The neoclassical growth model appears to be suitable, since there are at least three important features in the long run trends which are compatible with this model: · A close trend correlation between the growth of labour productivity and capital intensity. · Capital intensity and productivity grow at a similar rate in the long run. · If one looks over long periods of time and across the EU and the US, the employment rate appears to be unrelated with productivity growth. Using the neoclassical growth model this leads to the imposition of the following long run restrictions: · The labour market shock can have short and long run effects on employment, productivity and inflation. · The productivity shock can have long run effects on productivity and inflation but only short and medium run effects on employment. This constraint arises from the assumption that real wages are indexed to productivity in the long run. · The demand shock can have a long run effect on inflation only but not on employment and productivity. No long run constraint is imposed on inflation. These three types
of restrictions imply a triangular long run structure between the growth rate of
employment ( and the vector
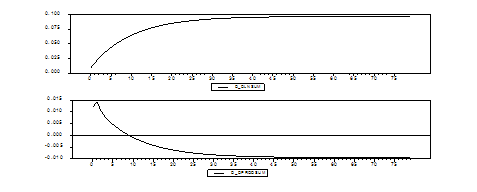
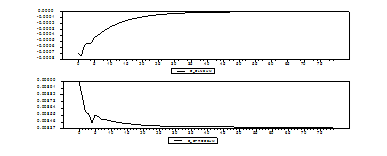
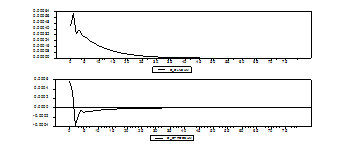
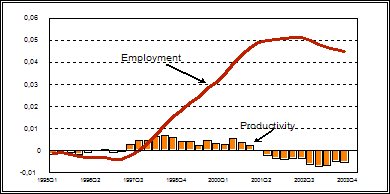
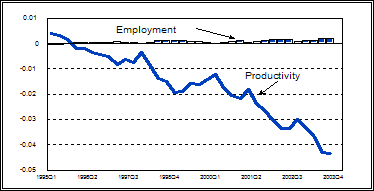
where the matrix A(1) shows the long run restrictions. Note, this particular structure is particularly suited to test for the short, medium and long run effects of an employment shock. Allowing for a non-zero long run productivity effect of an employment shock allows one to test for labour quality effects associated with a permanent change in the employment rate. A similar analysis of the employment effects of productivity shocks has been conducted by Gali (1999). The empirical results are presented in two steps. In step one, the impulse responses from the estimated VAR are presented. These responses give the impact on employment and productivity of a unit shock to employment, productivity and demand. Recall that the identifying restrictions imply that temporary unit shocks to employment can have permanent effects on employment and productivity, while a unit shock to demand (inflation) can only have temporary effects. In order to evaluate the quantitative magnitudes of these shocks, they are compared to similar shocks simulated with the Euro area QUEST model. This comparison is useful since it shows whether orders of magnitude from these shocks are similar when two very distinct empirical tools are used, with the VAR model imposing very little economic structure (apart from the long run constraints), while QUEST consists of explicitly estimated structural equations and estimated adjustment lags. · Employment shock: A positive employment shock initially leads to an increase in productivity; however, this short run positive effect in the VAR model is partly spurious. In the medium and long run the effect on productivity is negative, i.e. an increase in employment is associated with a decrease in labour quality. Note, though, that this negative long run effect is estimated to be small: a shock which leads to a permanent increase in the level of employment of about 1% is associated with a long run productivity level effect of about -0.1%. Analysis based on QUEST model simulations yields fairly similar results to the VAR approach, but the negative impact upon the productivity level is slightly stronger (-0.3 instead of -0.1) over the medium term; moreover, the QUEST model analysis does not reveal any short run increase in productivity. · Productivity shock: A positive productivity shock is associated, in the short-run, with a small negative employment effect. The order of magnitude of the employment effect is only about one tenth of the size of the productivity shock. By implication, this analysis suggests that a structural slowdown in labour productivity growth will, by itself, not be associated with an expansion of employment. Again, in the QUEST model analysis a qualitatively similar pattern to the VAR emerges, but the short-run negative employment response appears to be somewhat stronger. · Demand shock: The demand shock is initially associated with a positive employment and productivity effect. This result appears quite plausible, since a demand shock is likely to lead to better capacity utilisation in the short run. As the demand effect fades away and employment is slow to adjust, the productivity effect turns negative and dies out within a year. Graph 3: Impulse response analysis 3a) Employment shock
3b) Productivity shock
3c) Demand shock
Graph 4: QUEST analysis 4a) Employment shock
4b) Productivity shock
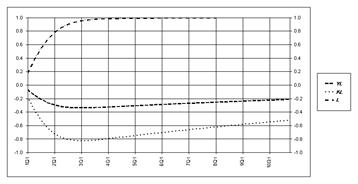
In the second step of the empirical analysis, the shocks are cumulated over the period 1995q1 to 2003q4 [5] in order to derive an estimate for the structural component in employment growth and its likely impact on productivity and vice versa. The results of this exercise are depicted in Graph 5. The cumulated size of the employment shock over the period 1995-2003 is estimated at about 5%. Thus, roughly one half of the overall observed employment expansion over that period is attributed to structural trend improvements. According to the VAR approach the cumulated productivity cost of this structural employment expansion may have amounted to ¾ of a percent; the QUEST model simulations would put the productivity cost somewhat higher at 1 ½ per cent. Roughly translated into year-on-year figures using a mid-point between the VAR and QUEST estimates, this implies a reduction in annual productivity growth of around two tenths of a percentage point, equivalent to some 20 % of the observed total productivity growth slowdown, which could be attributed to positive structural shocks in the labour market. Graph 5: Cumulated euro area employment shock 1995 Q1 to 2003 Q 4
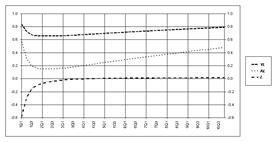
A further interesting result of the VAR model relates to the question of the structural versus temporary nature of the productivity growth slowdown. Based on the underlying assumptions on the short, medium and long term impact of the various shocks, the VAR model attributes most of the decline in productivity to a structural trend decline in productivity growth. As can be seen from Graph 6, the autonomous shock to productivity explains a decline in the level of productivity of almost 5%, which would translate into an annual average productivity growth rate effect of the order of -0.6 percentage points. This is fully consistent with the growth accounting result given earlier of a decline in TFP of the order of a ½ a percentage point, with TFP considered to be a reflection of the structural component of the productivity trend. Graph 6 also indicates that the autonomous productivity shock is unable to explain the increase in employment. Therefore, it is necessary to look separately at both shocks in order to give a complete picture of both the employment and productivity developments. However, concerning productivity, the overall conclusion from the analysis suggests that the decline in productivity growth is to a large extent structural in nature. Graph 6: Cumulated euro area productivity shock 1995 Q1 to 2003 Q 4
The empirical results presented above are quantitatively broadly in line with other available evidence on structural labour market improvements as indicated by a trend increase in participation and a reduction in structural unemployment. Moreover, relating the productivity effect to real wage moderation also suggests that the estimated impact on short-run productivity developments is of a reasonable order of magnitude. A stylised number for real wage moderation in the past 10 years or so would put the average annual reduction in real efficiency wages at slightly less than ½ a per cent. Thus, back-of the envelope calculations would suggest that real wage moderation could, on average, have reduced annual actual labour productivity growth relative to its balanced steady-state rate by about two tenths of a percentage point, which is well within the range derived from the VAR and QUEST model approaches. Further corroborating evidence stems from growth regressions suggesting that about 25% of the productivity decline is due to the increase in employment[6]. In summary, and recalling that the overall slowdown in average annual productivity growth has amounted to about one percentage point, it emerges as a fairly robust result that only some 20 % of this reduction can be attributed to the dynamic response of productivity to positive structural shocks in the labour market. 3. Conclusions In a nutshell, the analysis in this paper dismisses the notion of a genuine trade-off between employment and productivity growth. Obviously, misguided policies to exploit such a trade-off have to be avoided. However, there are no reasons to think that structural labour market reforms boosting employment will typically entail negative implications for longer-term productivity growth. In particular, this paper reaches the following conclusions: •The negative relationship between productivity and employment in comparative-static considerations should not be interpreted as a genuine trade-off. •However, all else equal, a move towards full employment is likely to see a widening of the labour productivity gap between Europe and the US. •The dynamic response of productivity to positive labour supply and wage shocks may entail a temporary reduction in productivity growth rates, which, in principle could be considered as benign; in any case, the size of a negative effect of this type is estimated to be fairly small. •The increase in employment since the mid 90s has indeed been to a significant extent the result of such positive labour market shocks, with about one half of the additional jobs attributed to structural improvements. •Positive employment shocks can only account for a very small fraction of the observed productivity slowdown; consequently, the decline of labour productivity growth must be considered as predominantly caused by other factors and probably not just a temporary phenomenon. Indeed, a cyclical pick-up in labour productivity growth after the recent period of weak output growth should not divert attention from the “deeper” structural problem of a slowdown in trend productivity growth. The implications of the above findings for the Lisbon strategy are straightforward: Indeed, “the more jobs the better” may serve as a simple catch-phrase characterising the principal goal of labour market reform efforts since there is no genuine trade-off – in the sense of a difficult decision to be made – between policies to raise the employment rate and policies to foster productivity growth. Of course, misguided policies attempting to exploit such a trade-off have to be avoided – if, for example, policy-makers promoted sectors with low productivity growth prospects, if they introduced unnecessary regulations leading to “over manning”, if they discouraged young people from pursuing further education, or if they used funds for public training programmes in an unproductive manner, then employment might be raised at the expense of longer-term productivity potential. However, none of these policies is advocated in the EU’s economic and employment policy framework and, in consequence, the employment strategy should not be blamed for the dismal productivity performance in recent years. [1] See Pichelmann and Roeger (2004) for an analysis of potential growth in the EU. [2] Labour augmenting technical progress is equal to Harrod-neutral technical progress when the capital stock grows at the same rate as output, thus leaving the capital-output ratio constant. For a Cobb-Douglas production function this “balanced” labour productivity growth rate is defined as TFP growth divided by the labour share. [3] Gordon (1995) provides a neat theoretical and empirical investigation as to how a productivity-unemployment trade-off might emerge and how it will subsequently be eliminated through a dynamic path of capital adjustment. [4] Obviously, misguided policies attempting to exploit a perceived trade-off have to be avoided, for example unnecessary regulations leading to “over manning”. [5] It should be noted that this provides an estimate for the overall magnitude of the shocks, but not of the impact these shocks have had on the macroeconomic aggregates. [6] See EU economy review 2003, Table A3. |